
Search our website enhanced by Google.

Produced for several key diseases of cereals and oilseed rape, ratings are calculated using disease information from three types of RL trial:
Inoculated trials promote high disease pressure. Such trials help bring out the differences between varieties and are particularly important. The inoculations also use pathogens with known characteristics, this means effects can be ascribed to a particular disease with greater confidence. For rusts, the UK Pathogen Virulence Survey (UKCPVS) provides isolates that are most representative of UK populations.
As part of the RL protocols, trained trial managers use visual disease assessment keys. This helps to ensure consistency in the disease rating process – from disease assessments, to validation of data, to the setting of high and low disease set points. AHDB also works closely with the pathology team at NIAB.
In July, AHDB receives disease data for validation. Only data from trials in which disease reaches 5% are included in the final dataset, although data are used for wider research purposes.
For diseases where there is a very large data set (e.g. septoria tritici blotch) or where there is the potential for rapid changes within the pathogen population (e.g. rusts), data from three years are used. For other diseases, data from five years are used.
In wheat, the top four leaves are assessed at various intervals. Where a top leaf has been fully expanded for less than 14 days, the second leaf is referred to as the top 'top leaf'. Naturally senescent leaf tissue is not assessed. All chlorosis and necrosis attributable to disease is recorded. Where disease is patchy, disease is scored as an average over the whole plot.
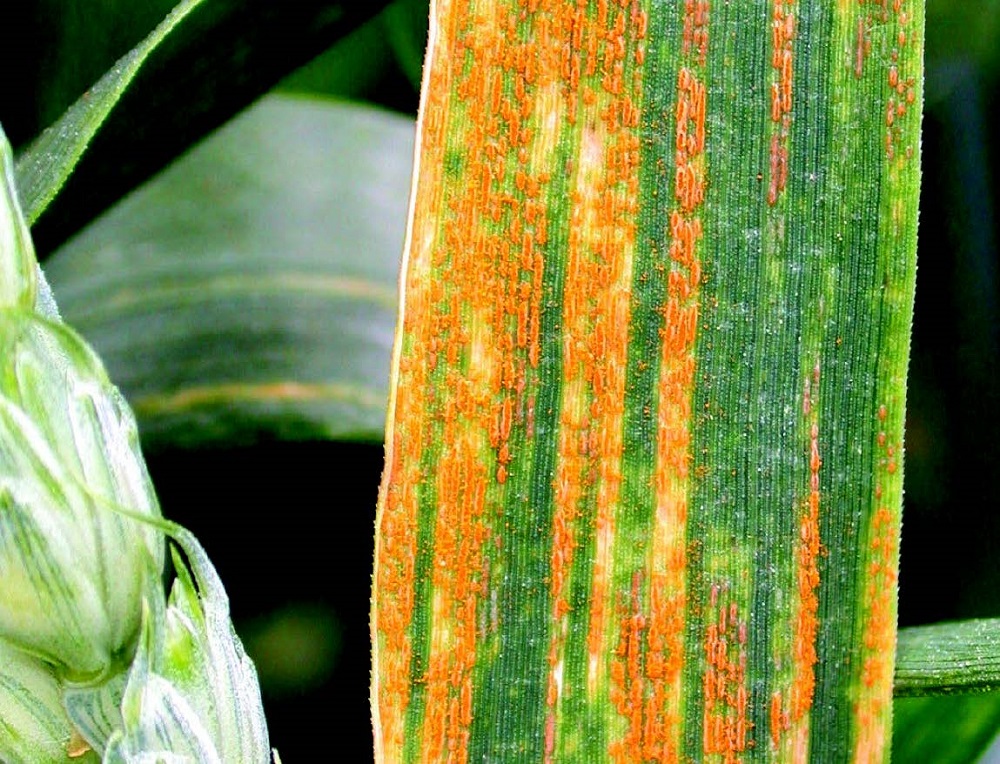
The following table provides an example of how yellow rust and septoria tritici are scored in wheat trials. Assessors use it as a guide to allocate a score – from 0% infection to 100% infection.
| Infection (%) | Yellow rust | Septoria tritici |
| 0 | No infection observed | |
| 0.1 | One stripe per tiller | One lesion per 10 tillers |
| 1 | Two stripes per leaf | Two small lesions per tiller |
| 5 | Most tillers infected but some top leaves uninfected | Small lesions beginning to form areas of dead tissue across width of leaf |
| 10 | All leaves infected but leaves appear green overall | Two lower leaves – large areas of diseased tissue, some covering a third of the leaf |
| 25 | Leaves appear half infected and half green | |
| 50 | Leaves appear more infected than green | |
| 75 | Very little green leaf tissue left | |
| 100 | Leaves dead (no green tissue left) | |
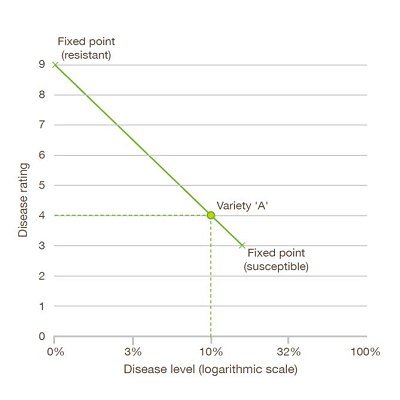
An over-years mean of disease severity is calculated for each disease in each variety. The varieties with the highest and lowest disease severity are then usually used to set high and low disease fixed points from which to compare other varieties. Due to the influence of the fixed points, only varieties that have been on the RL for several years, with well-established ratings or established disease control varieties, are used. In addition, a variety with very high levels of disease may not be selected, if its inclusion would skew the ratings for other varieties. For most diseases, a low disease fixed point of 9 = 0% disease is used to ensure that an RL rating of 9 reflects resistance.
For diseases where both natural and inoculated data are available, disease ratings are calculated from each data set. These are then combined, with a greater emphasis placed on the inoculated data, to give an overall disease rating. Careful checks are made to compare new disease ratings with those from the previous year to ensure that there is a good relationship for established varieties, unless there is evidence for a change in disease races. A change in a variety’s disease resistance rating between years could be due to the variety showing higher or lower disease symptoms relative to other varieties than it had in previous years or due to a change in the pathogen races.
In the booklet, disease ratings for septoria are presented to one decimal place. Other disease ratings are rounded to the nearest whole number (e.g. a rating calculated at 5.5 is rounded to 6).
It is important to note that ratings are calculated from historic data and not the current season. Therefore, it is necessary to monitor all crops for disease, even those with a high disease resistance rating, as varietal resistance has the ability to break down rapidly.
 AHDB
AHDB
In the Recommended Lists (RL), a susceptible and a resistant variety are selected to create 'fixed points'. A line drawn between these fixed points is used to calculate the disease ratings for all other varieties. In this example, variety 'A' has a disease level of 10%, which results in a wheat yellow rust disease rating of 4 in the 2021/22 edition
The RL 2021/22 sees major changes to the disease-rating-calculation approach for winter wheat yellow and brown rust. This section describes the main developments, including how they affect the headline ratings.
Typically, cereal disease ratings are based on the average level of disease in trials, observed over a three-year period. In the last few years, rust ratings have failed to reflect in-season field observations for some varieties at some locations. This is partly due to the increasingly diverse and dynamic nature of the UK’s rust populations and the rating-calculation method, but not the quality of disease data.
In response, two changes have been made to the way the yellow rust ratings are calculated. One of these changes has also been applied to the brown rust ratings.
Until now, ratings were based on three-year average disease ratings, with each year of data contributing an equal amount to the rating. Where pathogen populations are relatively stable, this method provides reliable and stable ratings. As wheat yellow and brown rusts populations are increasingly dynamic and diverse, a different approach to the rating-calculation is necessary.
The RL 2021/22 winter wheat rust ratings are now ‘weighted’, so that the most recent year of data has the largest (and the oldest year of data the smallest) influence on the rating. This approach makes the rating more sensitive to changes in rust population structure in the most recent year, while still using the valuable three-year dataset.
| Year 1 | Year 2 | Year 3 | Average disease (%) | Yellow rust rating (1–9) |
|
| Previous rating calculation | |||||
| Weighting | X1 | X1 | X1 | ||
| Variety A disease (%) | 8 | 8 | 8 | 8.0 | 5 |
| Variety B disease (%) | 6 | 8 | 10 | 8.0 | 5 |
| New rating calculation | |||||
| Weighting | X1 | X2 | X3 | ||
| Variety A disease (%) | 8 | 8 | 8 | 8.0 | 5 |
| Variety B disease (%) | 6 | 8 | 10 | 8.7 | 4 |
Established susceptible and resistant varieties are used to determine ‘fixed points’. A line between these fixed points is used to estimate the disease ratings for all varieties.
Overtime, the position of the susceptible fixed point has moved as a result of yellow rust population changes. This has had an undesired effect – susceptible varieties were achieving a higher rating at the end of the last decade, than the start of it. For example, a variety with 10% disease would have received a rating of 4 in 2012, but 5 in 2019.
The RL 2021/22 sees the scale reset to the 2012 slope, with a lower susceptible fixed point. This means, compared to the RL 2020/21, the same amount of disease will result in a lower rating. This has reduced the yellow rust rating for many varieties, however, this does not mean that these varieties have become more susceptible since last year. Even on varieties now rated 3, sufficient yellow rust control can be achieved with a combination of chemical and cultural controls.
RL yellow rust ratings reflect adult plant resistance, for young plant resistance and susceptibility visit the UKCPVS web page.
UKCPVS information on young-plant resistance information (wheat yellow rust)
The edition also saw the introduction of new disease ratings for winter rye (brown rust) and winter triticale (yellow rust), in addition to changes to the way spring oat mildew ratings are calculated.
