
Search our website enhanced by Google.
Updated 21 August 2023
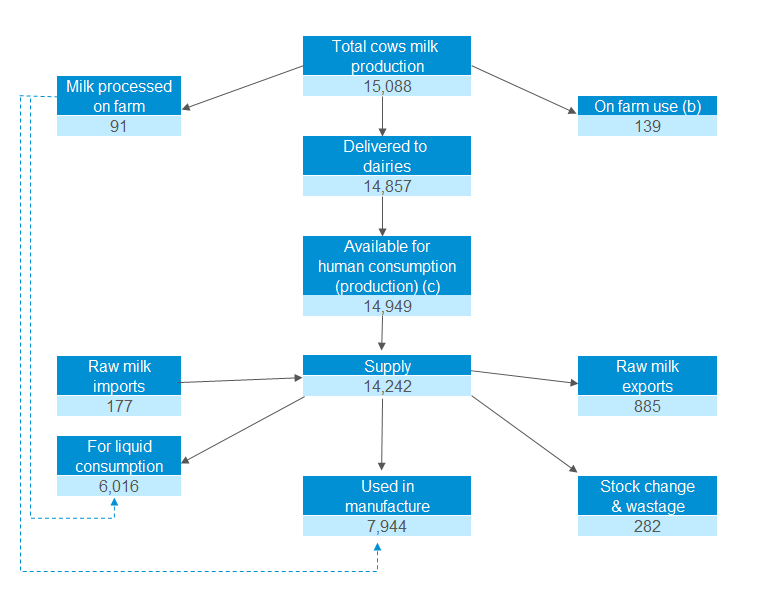
a) Provisional
b) Fed to stock and farm house use
c) Excludes farm use
This dataset was produced by our Data and Analysis Team. To find out more about the team, please visit the Data and Analysis team page.
If you need any further help, please email Martin, Gavin, Esther or Dorian at datum@ahdb.org.uk
While AHDB seeks to ensure that the information contained on this webpage is accurate at the time of publication, no warranty is given in respect of the information and data provided. You are responsible for how you use the information. To the maximum extent permitted by law, AHDB accepts no liability for loss, damage or injury howsoever caused or suffered (including that caused by negligence) directly or indirectly in relation to the information or data provided in this publication.
All intellectual property rights in the information and data on this webpage belong to or are licensed by AHDB. You are authorised to use such information for your internal business purposes only and you must not provide this information to any other third parties, including further publication of the information, or for commercial gain in any way whatsoever without the prior written permission of AHDB for each third party disclosure, publication or commercial arrangement. For more information, please see our Terms of Use and Privacy Notice or contact the Director of Corporate Affairs at info@ahdb.org.uk © Agriculture and Horticulture Development Board. All rights reserved.
© Agriculture and Horticulture Development Board 2024 | All Rights Reserved
Agriculture and Horticulture Development Board, Middlemarch Business Park, Siskin Parkway East, Coventry, CV3 4PE
