
Search our website enhanced by Google.
Updated 08 March 2023
*HS codes 0401-0406. Includes shipments of unprocessed milk/raw milk crossing the border for processing.
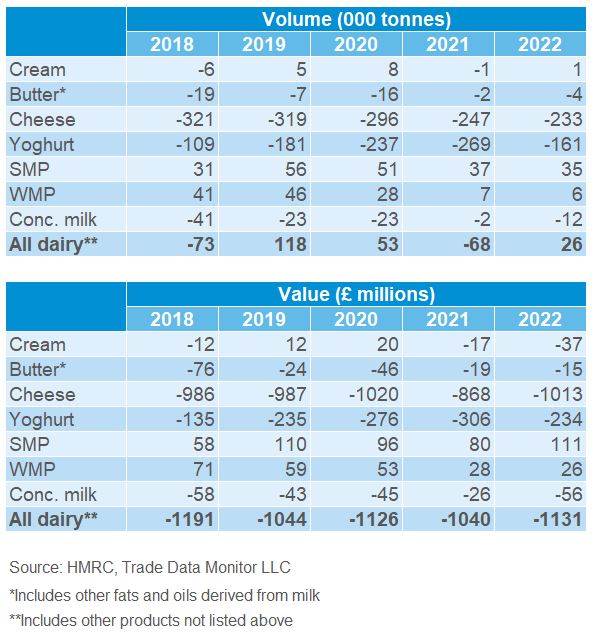
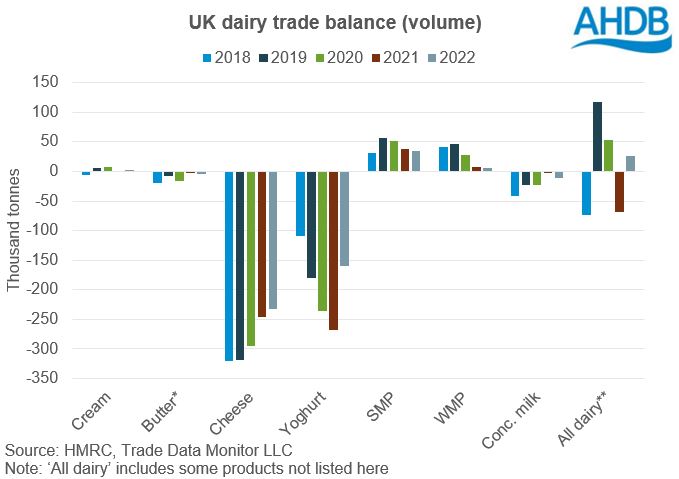
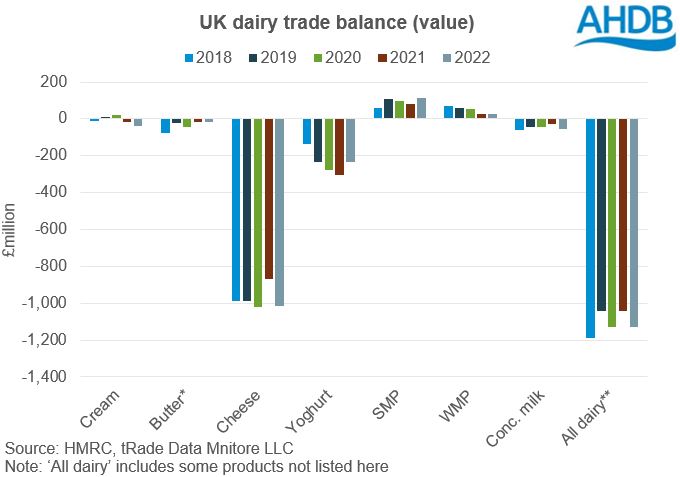
The trade balance is calculated as exports minus imports.
Total dairy (All dairy) here refers to HS codes 0401-0406 which includes shipments of unprocessed milk/raw milk crossing the border for processing.
The liquid milk category includes shipments of unprocessed milk/raw milk crossing the border for processing.
Butter here refers to the total 0405 category which includes other fats and oil derived from milk.
For descriptions of the product categories please see the notes section of the downloadable spreadsheet.
While AHDB seeks to ensure that the information contained on this webpage is accurate at the time of publication, no warranty is given in respect of the information and data provided. You are responsible for how you use the information. To the maximum extent permitted by law, AHDB accepts no liability for loss, damage or injury howsoever caused or suffered (including that caused by negligence) directly or indirectly in relation to the information or data provided in this publication.
All intellectual property rights in the information and data on this webpage belong to or are licensed by AHDB. You are authorised to use such information for your internal business purposes only and you must not provide this information to any other third parties, including further publication of the information, or for commercial gain in any way whatsoever without the prior written permission of AHDB for each third party disclosure, publication or commercial arrangement. For more information, please see our Terms of Use and Privacy Notice or contact the Director of Corporate Affairs at info@ahdb.org.uk © Agriculture and Horticulture Development Board. All rights reserved.
