
Search our website enhanced by Google.
Cereal Quality Survey results for harvest 2023 are now available. For the full tables of results use the download link located at the side of this page. For an explanation of the results and for the wheat quality diagrams, make sure to expand the sections below.
From November 2022, the methodology for validating samples has been updated. Please take this into consideration when comparing to historical figures. Comparisons in this commentary are to give context to this year’s results.
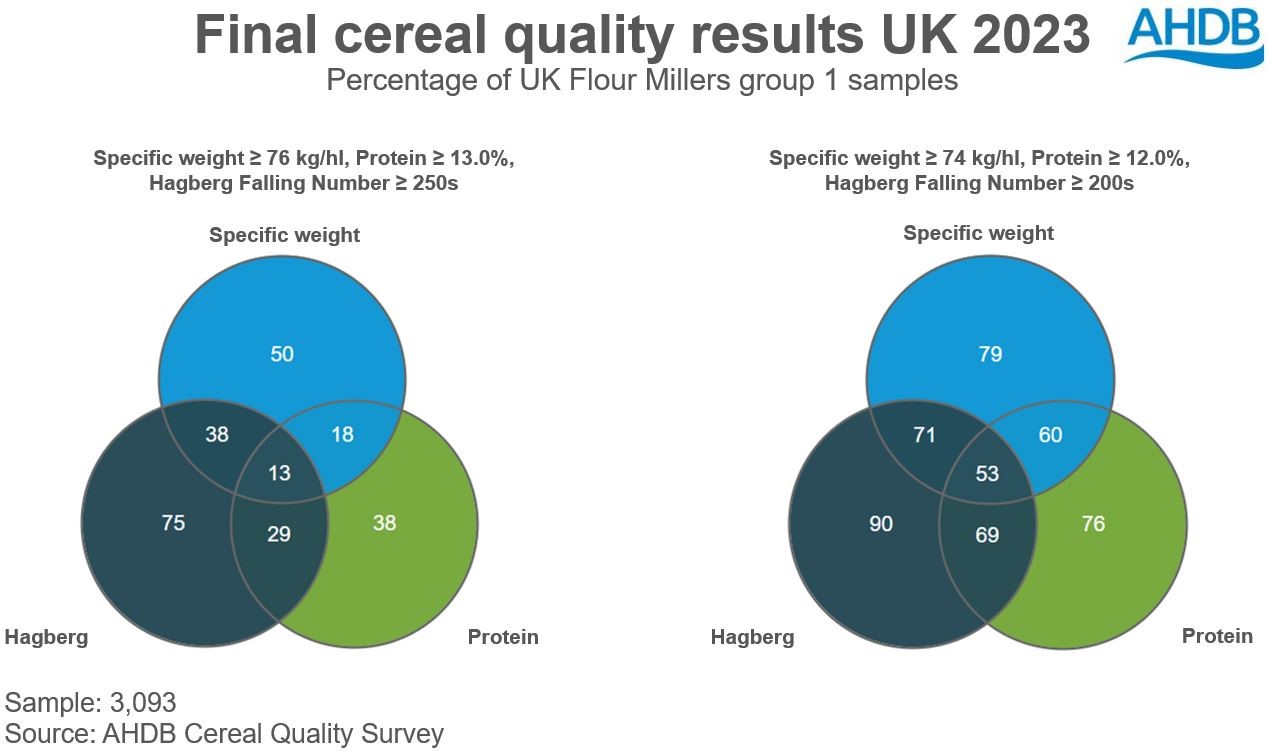
Results from the 2023 AHDB Cereal Quality Survey (CQS) show below average specific weights and protein content in milling wheat samples. Hagberg Falling Numbers are lower year-on-year reflecting the wet weather at harvest, with moisture levels also higher than usual. Data is up to 6 October.
The average protein content of UK Flour Millers group 1 varieties came in 0.3% percentage points (pp) below the milling specification of greater than or equal to 13%, at 12.7%. This is up slightly from the 2022 average of 12.6% but still lower than the three-year average of 12.9%.
The average specific weight of group 1 varieties came in at 75.8kg/hl, which is below the milling specification of greater than or equal to 76.0kg/hl. This is below both 2022’s high level (81.6kg/hl) and the three-year average.
Average Hagberg Falling Numbers of group 1 wheat varieties were at 285 seconds. This is 62s below last year and 33s below the three-year average.
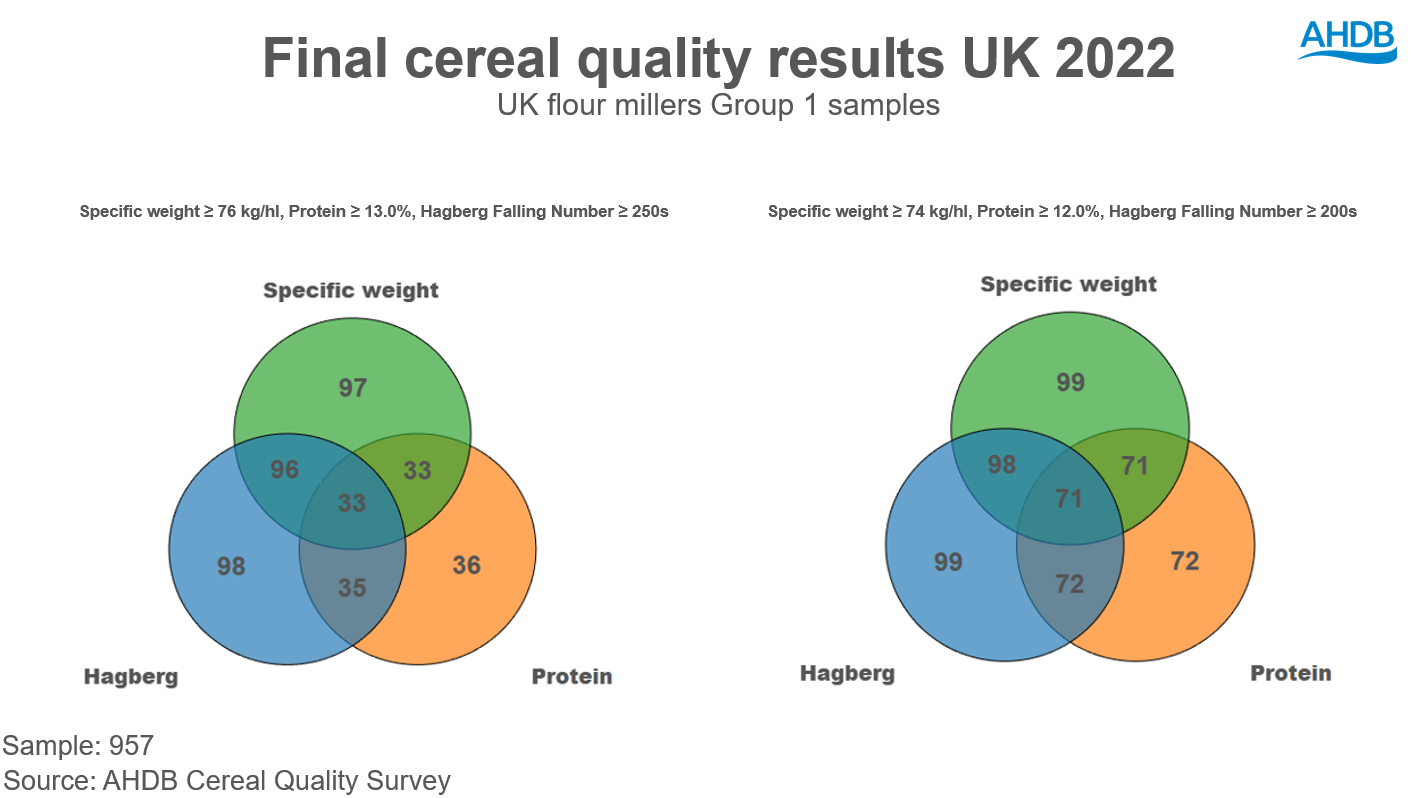
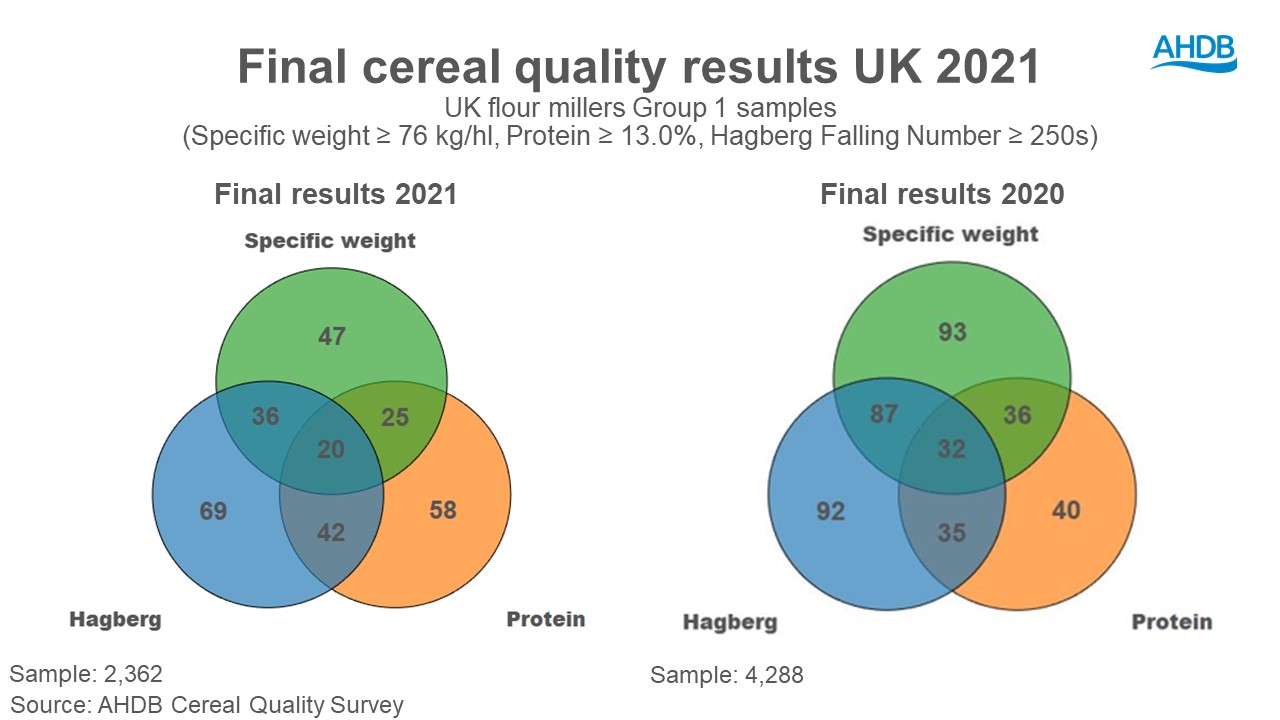
The 2023 results show that 13% of group 1 milling wheat samples met a typical group 1 specification (specific weight ≥ 76kg/hl, protein ≥ 13.0%, HFN ≥ 250s). This is down from 33% in 2022 and 20% in 2021. 53% of group 1 samples are meeting the following additional specification requirements: specific weight ≥ 74kg/hl, protein ≥ 12.0% and HFN ≥ 200. This is also down from last year’s 71%.
At 15.0%, the GB average moisture content is above last year’s low level and is likely the highest since 2012. However, there is regional variation. Averages of 14.7% are reported for the East of England and Midlands, while samples from Scotland averaged 16.1%.
The results show that average nitrogen content of GB barley samples is 1.63%.
For winter barley, nitrogen content averaged 1.70%, comparable to last year and marginally higher than the three-year average of 1.68%. The nitrogen content in spring barley samples averaged 1.62%. This is higher than in 2022 (1.50%) and the three-year average of 1.56%.
Across all samples, specific weights average 62.6kg/hl, down from last year’s 66.5kg/hl and well below the three-year average. The 2023 average is also likely the lowest in the history of the survey, which began in 1977, though the change in methodology in 2022 should be noted.
Specific weights for winter varieties average 64.9kg/hl, down 3.2kg/hl year-on-year but similar to 2021 (64.8kg/hl). However, for spring varieties the average specific weight is 62.4kg/hl, a fall of 4.0kg/hl year-on-year.
The proportion of barley retained by a 2.5mm sieve was 82.0% for winter barley and 94.5% for spring barley. For winter barley this is 4.7pp lower than in 2022 and 7.7pp lower than the three-year average. Whilst for spring barley this is just 0.1pp lower than in 2022 but 0.7pp lower than the three-year average.
When looking at this year’s results, it is worth noting that some samples may include admixture.
Across all barley samples, the average moisture content is 16.0%. This is sharply up from last year’s low level of 14.3% and slightly above 2021 (15.9%).
The 2023 wheat and barley sample sizes were larger than in 2022 at 7,449 and 11,445 respectively.
From November 2022, the methodology for validating samples has been updated. Please take this into consideration when comparing to historical figures.
Some samples may not contain results for all quality parameters; some screening values % through 2.25mm may include admixture.
While AHDB seeks to ensure that the information contained on this webpage is accurate at the time of publication, no warranty is given in respect of the information and data provided. You are responsible for how you use the information. To the maximum extent permitted by law, AHDB accepts no liability for loss, damage or injury howsoever caused or suffered (including that caused by negligence) directly or indirectly in relation to the information or data provided in this publication.
All intellectual property rights in the information and data on this webpage belong to or are licensed by AHDB. You are authorised to use such information for your internal business purposes only and you must not provide this information to any other third parties, including further publication of the information, or for commercial gain in any way whatsoever without the prior written permission of AHDB for each third party disclosure, publication or commercial arrangement. For more information, please see our Terms of Use and Privacy Notice or contact the Director of Corporate Affairs at info@ahdb.org.uk © Agriculture and Horticulture Development Board. All rights reserved.
